Object-Oriented Programming (OOP) is a programming paradigm based on the concept of “objects” that contain data and methods. In Android development using Java, mastering OOP is essential for building clean, scalable, and maintainable apps.
1. Inheritance in Java (Android Studio)
Definition:
Inheritance allows one class (child or subclass) to inherit the properties and methods of another class (parent or superclass).
Example:
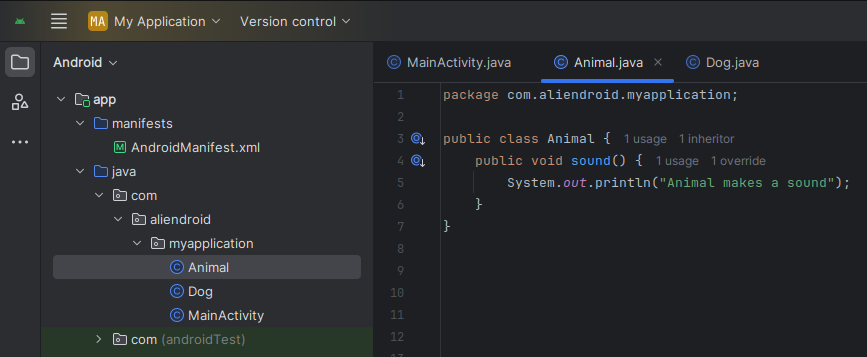
// Parent class
public class Animal {
public void sound() {
System.out.println("Animal makes a sound");
}
}
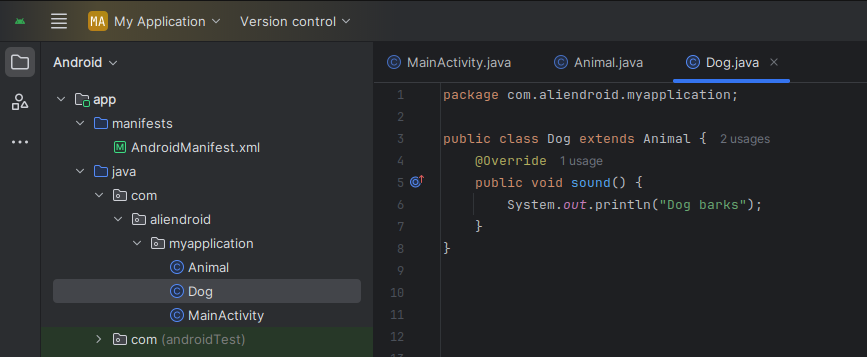
// Child class
public class Dog extends Animal {
@Override
public void sound() {
System.out.println("Dog barks");
}
}
Android Usage Example:
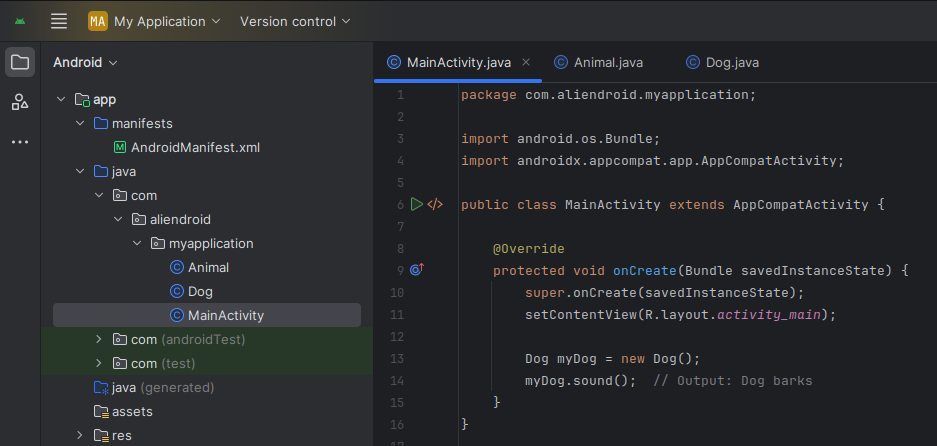
public class MainActivity extends AppCompatActivity {
    @Override
    protected void onCreate(Bundle savedInstanceState) {
        super.onCreate(savedInstanceState);
        setContentView(R.layout.activity_main);

        Dog myDog = new Dog();
        myDog.sound();  // Output: Dog barks
    }
}
2. Polymorphism in Java (Android Studio)
Definition:
Polymorphism allows objects to be treated as instances of their parent class rather than their actual class.
Types:
- Compile-time (Method Overloading)
- Runtime (Method Overriding)
Example:
public class Animal {
    public void makeSound() {
        System.out.println("Animal sound");
    }
}

public class Cat extends Animal {
    @Override
    public void makeSound() {
        System.out.println("Cat meows");
    }
}
Usage in Android:
Animal myAnimal = new Cat();
myAnimal.makeSound();  // Output: Cat meows
3. Encapsulation in Java (Android Studio)
Definition:
Encapsulation is the process of wrapping data (variables) and methods that operate on the data into a single unit, typically a class. Access to the data is controlled through getters and setters.
Example:
public class User {
    private String username;

    public void setUsername(String name) {
        this.username = name;
    }

    public String getUsername() {
        return username;
    }
}
Android Example:
User user = new User();
user.setUsername("AliendroID");
Log.d("USERNAME", user.getUsername());  // Output: AliendroID
Conclusion
Understanding OOP Concepts in Java for Android Studio—Inheritance, Polymorphism, and Encapsulation—is vital for writing robust and scalable Android apps. By applying these principles, you’ll develop code that’s cleaner, easier to manage, and better suited for collaboration and testing.