How To Debug Code Efficiently
How to debug code efficiently is crucial for any software developer. This guide dives deep into the art of identifying and fixing errors in your code, from basic syntax issues to complex logic problems. We’ll explore various debugging strategies, tools, and techniques, ultimately equipping you with the skills to tackle even the most challenging bugs with confidence and speed.
We’ll cover everything from understanding different types of errors and interpreting error messages, to mastering debugging tools and strategies like breakpoints and print statements. The guide also delves into advanced techniques such as using memory debuggers and code reviews, and provides actionable steps to optimize your debugging workflow.
Introduction to Efficient Debugging
Debugging is the process of identifying and resolving defects or errors in software code. It’s a crucial skill for software developers, as errors can significantly impact the functionality and reliability of applications. Efficient debugging is not just about finding the bug; it’s about finding it quickly and effectively, minimizing disruption to the development process. Effective debugging saves time and resources, and ultimately leads to higher quality software.Efficient debugging is essential in software development for several reasons.
Firstly, it ensures the quality and reliability of the software product. Secondly, it minimizes wasted time and resources, allowing developers to focus on other tasks. Thirdly, it helps in identifying potential vulnerabilities and improving the overall robustness of the software. Debugging skills are highly valued in the industry, and are essential for developers to contribute effectively to projects.
Common Pitfalls in Debugging
Many developers encounter common pitfalls while debugging. One common issue is jumping to conclusions without thoroughly analyzing the code. Another is failing to use appropriate debugging tools or strategies. Lack of systematic approach and insufficient understanding of the codebase are also significant challenges. Lastly, overlooking edge cases and insufficient testing can lead to undetected errors.
Setting Up a Debugging Environment
A well-structured debugging environment is crucial for efficient debugging. This involves choosing an appropriate development environment (IDE) and installing essential debugging tools. A clean, organized project structure can make a significant difference. Clear naming conventions for variables and functions aid in understanding the codebase, while comprehensive documentation improves comprehension. Furthermore, ensuring that the development environment is consistent across different platforms can also help in avoiding platform-specific errors.
Debugging Tools and Technologies
Effective debugging relies heavily on appropriate tools. Modern IDEs usually provide robust debugging features, such as breakpoints, stepping through code, and inspecting variables. Specialized debugging tools, like debuggers and profilers, offer additional capabilities for in-depth analysis. Logging mechanisms are essential for tracking program execution and identifying problematic areas.
Comparison of Debugging Tools
| Tool | Strengths | Weaknesses | Use Cases |
|---|---|---|---|
| Integrated Development Environments (IDEs) like Visual Studio or Eclipse | User-friendly interface, integrated debugging features, support for various languages, and code completion. | Can be resource-intensive, learning curve might be steep for beginners, and sometimes feature-rich IDEs can be overwhelming. | General debugging for most programming languages, stepping through code, setting breakpoints, inspecting variables, and exploring code structure. |
| Dedicated Debuggers (e.g., GDB, LLDB) | Powerful control over the debugging process, low-level access to the program’s state, and often more flexible and fine-grained than IDE debuggers. | Steeper learning curve, less user-friendly interface compared to IDE debuggers, and require more manual configuration. | Advanced debugging tasks, low-level debugging, performance profiling, and investigating complex issues that require precise control over the program’s execution. |
| Profilers (e.g., cProfile, Visual Studio Profiler) | Identify performance bottlenecks, pinpoint slow sections of code, and help optimize the program for better efficiency. | May not be as effective for identifying logical errors, and can be more complex to use than simple debuggers. | Performance analysis, optimization of code, and understanding resource usage during program execution. |
Understanding Code Errors
Identifying and resolving errors is a crucial aspect of effective programming. Knowing the different types of errors and how to interpret associated messages is vital for efficient debugging. A systematic approach to tracing errors, combined with the use of debugging logs, significantly streamlines the process of fixing issues in code.Effective debugging hinges on understanding the nature of errors encountered during the development process.
These errors can range from simple typos to complex logical flaws, each requiring a different approach to resolution. A clear understanding of the types of errors and how to interpret the accompanying error messages is paramount to successful debugging.
Different Types of Errors
Various types of errors can disrupt the execution of code, impacting its functionality. Understanding these differences is key to selecting the appropriate debugging strategy.
- Syntax Errors: These errors arise from violations of the programming language’s grammatical rules. The compiler or interpreter flags these errors, typically pointing to the exact location of the problem. They are often the easiest to resolve, as they involve correcting the code’s structure rather than its logic.
- Runtime Errors: These errors occur during the execution of a program. They are often caused by unexpected conditions or situations that the program is not designed to handle. Examples include division by zero, attempting to access an array element outside its bounds, or using a variable that has not been initialized. Runtime errors typically produce specific error messages that detail the issue.
- Logic Errors: These errors are subtle and can be challenging to detect. They arise when the program’s logic is flawed, resulting in incorrect outputs or unintended behavior, even though the code compiles and runs without producing explicit error messages. The program may appear to run, but its results are not as expected.
Interpreting Error Messages
Error messages, while often cryptic, contain crucial information for pinpointing the source of a problem. Carefully analyzing these messages can save significant debugging time.
- Understanding Error Messages: Error messages usually indicate the type of error, the location in the code where the error occurred, and sometimes even a hint about the cause. Paying close attention to these details is essential for effective debugging.
- Extracting Information: Identify the specific error type (e.g., “TypeError,” “IndexError”). Note the line number where the error occurred. Look for any associated messages that might offer clues about the cause of the error. These messages often include specific details that can guide the troubleshooting process.
Tracing the Source of Errors
Tracing the source of errors requires a systematic approach to identify the precise location of the problem.
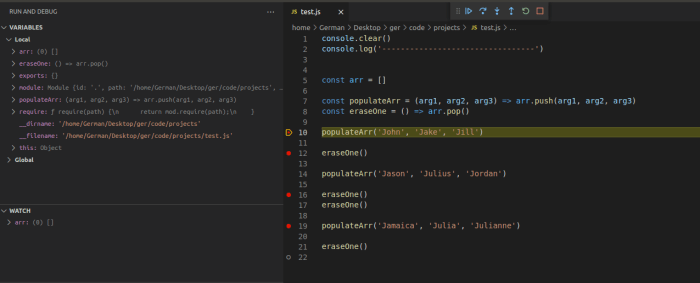
- Using Print Statements: Inserting print statements strategically within the code can help track the flow of execution and the values of variables at different points. This is particularly helpful for understanding how data is manipulated and transformed within the program.
- Stepping Through Code: Debugging tools often offer a step-by-step execution mode. This allows you to examine the program’s state at each step, allowing you to observe the values of variables and the flow of control.
Debugging Logs
Debugging logs are invaluable for recording events during program execution. This record provides a detailed history of program behavior.
- Importance of Debugging Logs: Debugging logs provide a comprehensive record of events, variable values, and function calls. They are essential for understanding the program’s behavior, particularly in complex situations.
- Implementing Logging Mechanisms: Employing logging mechanisms in your code allows you to record important information, such as the current state of variables, specific function calls, or error messages. This facilitates a more thorough investigation into the source of issues.
Common Error Types and Causes
The table below summarizes common error types, their descriptions, typical causes, and illustrative examples.
| Error Type | Description | Typical Causes | Example |
|---|---|---|---|
| Syntax Error | Violation of the programming language’s grammar rules. | Incorrect use of s, operators, or punctuation; missing semicolons, parentheses, or brackets. | `print(“Hello”);` (missing closing parenthesis) |
| Runtime Error | An error that occurs during program execution. | Division by zero, accessing an array element outside its bounds, using an uninitialized variable, invalid input. | `result = 10 / 0;` (division by zero) |
| Logic Error | A flaw in the program’s logic that results in incorrect outputs or unexpected behavior. | Incorrect calculations, flawed conditional statements, inefficient algorithms, missing or incorrect loops. | Calculating the average of a list of numbers without considering empty lists. |
Debugging Strategies and Techniques: How To Debug Code Efficiently
Effective debugging is a crucial skill for any programmer. It involves systematically identifying and resolving errors in code to ensure program functionality. A methodical approach, coupled with the right tools and strategies, can significantly reduce the time spent on finding and fixing bugs. This section delves into various debugging strategies and techniques, providing a comprehensive guide for efficient error resolution.Debugging often requires a methodical approach, starting with understanding the problem and working towards a solution.
The techniques discussed here provide a framework for navigating the debugging process.
Step-by-Step Debugging Process
A systematic debugging process typically involves several steps. First, identify the error by carefully reviewing the code and observing the program’s behavior. Next, isolate the problematic code section, often by using breakpoints and stepping through the code. This allows for a precise examination of variables and execution flow. Finally, correct the identified error and retest the code to ensure the problem is resolved.
Using Breakpoints and Stepping Through Code
Breakpoints are critical for controlling program execution. They pause the program’s execution at specific lines of code, enabling the developer to examine the state of variables and program flow. Stepping through code allows the developer to trace the program’s execution one line at a time. This step-by-step approach provides a detailed understanding of how the code functions. Integrated Development Environments (IDEs) often offer tools for setting breakpoints and stepping through code.
Leveraging Print Statements for Debugging
Print statements are a valuable tool for debugging. They allow developers to display the values of variables or messages at specific points in the code, providing insights into the program’s execution. This method is especially useful for tracking program flow and variable changes during execution. They can be inserted into the code temporarily to facilitate understanding.
Isolating Problematic Code Sections
The ability to isolate problematic code sections is paramount for efficient debugging. This can involve progressively narrowing down the suspect code base through testing and analysis. By isolating the problematic part of the code, the developer can focus their efforts on resolving the error without needing to consider the entire codebase. Common techniques include commenting out code sections, or temporarily modifying the code to eliminate potential sources of error.
Utilizing Debuggers for Program Analysis
Debuggers provide powerful tools for analyzing program execution. They allow developers to monitor variables, inspect the call stack, and step through code to understand the program’s behavior. Using debuggers effectively enables a precise examination of the program’s inner workings. Different debuggers may have different interfaces and features, but their core purpose remains the same.
Comparing Debugging Strategies (Top-Down vs. Bottom-Up)
Top-down debugging focuses on examining the code from the highest level of abstraction, gradually drilling down into specific modules. Bottom-up debugging starts with examining the lower-level modules, and then working towards the higher-level components. The most effective strategy often depends on the specific nature of the error and the structure of the code. Choosing between top-down and bottom-up approaches requires careful consideration of the problem’s characteristics.
Advanced Debugging Techniques
Debugging beyond the basics often requires more sophisticated tools and strategies. Moving from surface-level errors to underlying issues necessitates a deeper understanding of program execution and interaction with system resources. This section delves into advanced techniques that can significantly improve debugging efficiency.
Memory Debuggers
Memory debuggers are powerful tools for identifying memory-related errors, a common source of program crashes or unexpected behavior. They allow detailed inspection of memory allocation, deallocation, and usage patterns during runtime. This detailed examination helps uncover memory leaks, dangling pointers, and buffer overflows. Understanding the program’s memory footprint during execution is crucial for identifying and fixing these subtle issues.
Using these tools effectively often involves setting breakpoints and examining variables to track memory changes, enabling a clearer picture of the program’s memory management activities.
Code Reviews
Code reviews, a collaborative debugging strategy, are instrumental in identifying subtle logic errors, potential security vulnerabilities, and maintainability issues. Peer review can catch errors that an individual developer might overlook. Experienced developers, with their different perspectives and understanding of the codebase, can spot issues more quickly and offer alternative solutions, leading to more robust and maintainable code.
Profiling Tools
Profiling tools analyze program performance by measuring execution time for various code sections. This analysis helps identify bottlenecks, areas of code where the program spends the most time, and inefficient algorithms. Profiling results are often presented graphically, highlighting performance hotspots for targeted optimization efforts. For example, if a particular function consistently takes longer than expected, profiling can pinpoint the specific operations within the function that contribute to the slow execution time.
Understanding and resolving these bottlenecks can dramatically improve the application’s responsiveness and overall performance.
Code Analysis Tools
Various code analysis tools exist, each with unique capabilities for static analysis and automated code inspection. Some tools focus on identifying potential bugs, while others highlight code style issues, security vulnerabilities, and performance bottlenecks. Tools like SonarQube, for instance, perform a comprehensive analysis of the codebase, detecting potential problems before they lead to runtime errors. Choosing the right tool depends on the specific needs and priorities, such as identifying potential bugs, enhancing code quality, or improving maintainability.
A comparative table can help in selecting the appropriate tool for the specific use case.
| Tool | Focus | Strengths | Weaknesses |
|---|---|---|---|
| SonarQube | Comprehensive code quality | Identifies bugs, code smells, security vulnerabilities | Can be complex to configure |
| FindBugs | Bug detection | Fast, reliable bug detection | Limited code analysis scope |
| PMD | Code style and design | Automated code style enforcement | Limited bug detection |
Code Refactoring
Code refactoring involves restructuring existing code without changing its external behavior. This process aims to improve code readability, maintainability, and testability. By simplifying complex logic, separating concerns, and using more descriptive variable names, refactoring enhances debugging efforts. This makes the code easier to understand, which reduces the time spent on troubleshooting issues. It also increases the resilience of the code to future changes.
For example, rewriting a convoluted algorithm into a more modular structure can significantly reduce the chances of introducing bugs and greatly aid in debugging the code in the future.
Debugging Patterns
Certain recurring patterns often appear in debugging processes. Recognizing these patterns can help developers to more quickly pinpoint and resolve common issues. The following are a few examples of common debugging patterns:
- Input Validation Errors: Checking input data for expected types and ranges can prevent many unexpected program behaviors. Ensure all inputs conform to specifications.
- Unhandled Exceptions: Implement comprehensive exception handling to prevent program crashes due to unforeseen errors. This can involve using try-catch blocks or similar constructs to catch and manage exceptional situations.
- Race Conditions: When multiple threads or processes access and modify shared resources concurrently, race conditions can arise. Careful synchronization mechanisms are needed to prevent inconsistencies and errors.
- Resource Leaks: Resources like files or network connections need to be released appropriately to prevent memory leaks or other resource-related problems. Using appropriate cleanup mechanisms is crucial to avoid such issues.
Optimizing Debugging Workflow
Preventing errors and streamlining the debugging process are crucial for efficient software development. A well-structured approach that integrates proactive measures and effective strategies can significantly reduce the time and effort spent on debugging. This section details techniques to optimize your debugging workflow, from code prevention to sophisticated debugging frameworks.A proactive approach to debugging is far more effective than reacting to errors.
This involves focusing on creating code that is less prone to errors in the first place. This, combined with systematic debugging strategies and tools, can dramatically improve development speed and code quality.
Preventing Errors, How to debug code efficiently
Proactive error prevention is a cornerstone of efficient debugging. This includes a combination of coding best practices, rigorous testing, and thoughtful code reviews. By addressing potential issues before they manifest as errors, the debugging process becomes far more streamlined and effective.Careful consideration of potential issues and employing defensive programming techniques are key components of proactive error prevention. This involves anticipating edge cases and situations that could lead to unexpected behavior.
Thorough documentation of the code’s intended behavior and the reasons behind design choices will greatly help in debugging.
Writing Clean and Well-Documented Code
Writing clean, well-documented code is essential for efficient debugging. Clear variable names, meaningful function names, and consistent code formatting significantly improve readability and understanding. This makes it easier to grasp the code’s logic and identify potential problems quickly.Well-commented code provides context and explanation, enabling developers to quickly understand the intent behind different sections of the code. This context is invaluable during debugging, as it allows for a faster and more accurate analysis of the error.
Code Reviews and Testing
Code reviews and rigorous testing are vital for detecting and addressing potential errors early in the development process. Peer reviews offer fresh perspectives and help uncover potential logical flaws or areas where the code might behave unexpectedly.Comprehensive testing, encompassing unit tests, integration tests, and end-to-end tests, validates the code’s functionality and identifies potential bugs before they cause issues in the final product.
This proactive approach reduces the likelihood of encountering unexpected errors during debugging.
Efficient Debugging Framework
A well-defined debugging framework can streamline the process and ensure consistent application of best practices. This framework should Artikel steps for isolating the problem, analyzing the error, and implementing a solution. Documentation of the framework ensures all team members are aware of the standard operating procedure for troubleshooting.The framework should include clear guidelines for reporting bugs, documenting solutions, and incorporating lessons learned from debugging sessions.
This framework will foster a culture of continuous improvement and error prevention.
Version Control in Debugging
Version control systems, such as Git, play a critical role in debugging. They provide a history of code changes, enabling developers to track down the introduction of a bug and revert to a previous, stable version if necessary.Version control systems also allow for collaboration on debugging efforts. Multiple developers can work on identifying the root cause of an issue, sharing insights, and proposing solutions without disrupting the project’s progress.
Best Practices for Efficient Debugging
| Practice | Description | Benefits | Example |
|---|---|---|---|
| Clear Naming Conventions | Using descriptive and consistent names for variables, functions, and classes. | Improved code readability and maintainability, reducing confusion and errors. | Instead of `x`, use `userAge` for a variable storing a user’s age. |
| Thorough Documentation | Adding comments and documentation to explain the purpose and functionality of code sections. | Enhanced understanding of the code, aiding in debugging and future maintenance. | Including a comment explaining the logic behind a complex calculation. |
| Comprehensive Testing | Implementing unit tests, integration tests, and end-to-end tests to validate the code’s behavior. | Early detection of bugs, reducing the risk of regressions and unexpected errors. | Writing unit tests to ensure individual functions work as expected. |
| Version Control | Utilizing Git or similar systems to track code changes, enabling rollback to previous versions. | Facilitating collaboration, allowing for easier debugging of issues and reverting to stable versions. | Using Git branches for experimental code changes. |
Debugging Specific Scenarios
Debugging is a crucial skill for any developer. Effective debugging goes beyond just identifying errors; it involves understandingwhy* errors occur and how to prevent them in the future. This section delves into specific debugging scenarios across various programming contexts, offering practical examples and strategies.
Debugging in Different Programming Languages
Different programming languages often have unique error messages and debugging tools. Understanding these nuances is essential for efficient debugging. For instance, Python’s error messages are generally more descriptive than those in C++, providing more context for the source of the problem. Java, with its robust debugging tools, often helps isolate errors within complex code structures. Understanding the specific debugging tools available in each language is vital.
Debugging Common Web Development Problems
Web development presents a unique set of debugging challenges. These include issues related to front-end rendering, back-end API interactions, and database queries. For instance, a common issue is incorrect JavaScript code leading to broken user interfaces. Thorough testing, including unit testing and integration testing, is crucial to catch these problems early.
Debugging Mobile Application Issues
Debugging mobile applications requires a different approach compared to web or desktop applications. These applications often involve complex interactions between the user interface, backend services, and hardware components. Careful analysis of logs, often provided by the mobile device itself, is crucial for understanding the root cause of problems.
Debugging Large and Complex Systems
Debugging in large and complex systems, like enterprise-level applications, necessitates a methodical approach. Strategies like isolating modules, using logging frameworks, and leveraging profiling tools are critical for identifying and fixing errors. Effective code modularization is a cornerstone of successful debugging in large projects.
Debugging Multi-Threaded Applications
Multi-threaded applications introduce new complexities due to concurrent operations. Errors can stem from race conditions, deadlocks, and shared resource contention. Debugging these issues requires tools that allow inspection of the execution flow across multiple threads. Understanding thread synchronization mechanisms is key to resolving these issues.
Code Snippets Demonstrating Debugging Techniques
The following code snippets illustrate debugging techniques in various contexts.
Python Debugging Example
“`pythondef calculate_average(numbers): if not numbers: raise ValueError(“List cannot be empty”) return sum(numbers) / len(numbers)try: result = calculate_average([])except ValueError as e: print(f”Error: e”) # Correctly handles the error“`
JavaScript Debugging Example
“`javascriptfunction calculateTotal(prices) let total = 0; for (let i = 0; i < prices.length; i++) if (typeof prices[i] !== 'number') console.error("Invalid price:", prices[i]); return NaN; // Return NaN for invalid input total += prices[i]; return total; let prices = [10, 20, 30, "abc"]; let total = calculateTotal(prices); console.log("Total:", total); ``` These examples demonstrate how to handle potential errors (empty list in Python, non-numeric values in JavaScript) using `try...except` blocks in Python and error handling and logging in JavaScript. Proper error handling and logging are vital for efficient debugging.
Tools and Technologies for Efficient Debugging
Effective debugging relies heavily on the right tools. Choosing and mastering these tools can significantly reduce debugging time and improve code quality. The ideal toolset will streamline the process, providing visibility into the code’s inner workings and facilitating the identification and resolution of issues.Debugging tools are indispensable for developers, enabling them to step through code, inspect variables, and identify the root cause of errors.
They often provide invaluable insights into program execution flow, memory usage, and other critical aspects, ultimately accelerating the debugging process.
Popular Debugging Tools
A variety of debugging tools cater to different programming languages and development environments. Their features and capabilities often overlap, but specific strengths allow for tailored choices based on the situation. Selecting the appropriate tool is crucial for efficient debugging.
Features and Capabilities of Popular Debugging Tools
Common features of debugging tools include breakpoints, variable inspection, call stack analysis, and stepping through code. Breakpoints allow pausing code execution at specific lines, providing a snapshot of the program’s state. Variable inspection lets developers examine the values of variables at various points, while call stack analysis helps understand the sequence of function calls leading to an error.
Stepping through code allows developers to observe the program’s behavior line by line.
Examples of Using Debugging Tools
Consider a scenario where a JavaScript function isn’t returning the expected output. A debugger would enable stepping through the function, inspecting the values of variables at each step, and identifying the point where the calculation deviates from the expected outcome. This can pinpoint a subtle error in the logic or data manipulation. Similarly, in a Python application, if a database query fails, a debugger would allow examination of the query’s parameters and the database’s response, isolating the cause of the failure.
Integration with Development Environments
Many debugging tools integrate seamlessly with popular development environments like Visual Studio Code, Eclipse, and IntelliJ IDEA. This integration often includes features like automatic breakpoints, quick variable inspection, and intuitive graphical interfaces, simplifying the debugging process. This integration minimizes context switching, enhancing overall developer workflow.
Comparison of Debugging Tool Options
Different debugging tools offer various strengths. Some might excel at handling complex memory management issues, while others provide enhanced support for specific programming languages. For instance, a tool designed for C++ might have superior memory profiling capabilities compared to a tool designed for Python. Careful consideration of the specific needs of a project and the developer’s familiarity with the tool are crucial in selecting the optimal debugging solution.
Table of Popular Debugging Tools
| Tool | Features | Platform Compatibility | Ease of Use |
|---|---|---|---|
| GDB (GNU Debugger) | Powerful command-line debugger, excellent for low-level debugging, supports various languages | Linux, macOS, Windows | Steep learning curve, but highly customizable |
| Visual Studio Debugger | Integrated debugger for C++, C#, and other languages within Visual Studio, user-friendly interface | Windows | User-friendly interface, strong integration with development environment |
| Chrome DevTools | Powerful debugging tool for web development, allows inspecting JavaScript code, network requests, and more | Web Browsers (Chrome, Edge) | Intuitive interface, designed for web development tasks |
| LLDB (Low-level Debugger) | Powerful command-line debugger for macOS and iOS, suitable for complex scenarios | macOS, iOS | Steep learning curve, but highly customizable |
Last Word
Source: freecodecamp.org
In conclusion, this comprehensive guide has provided a detailed roadmap for efficient code debugging. By understanding the common pitfalls, employing effective strategies, and leveraging the right tools, you can significantly improve your development process and deliver high-quality software. Remember, consistent practice and a proactive approach to debugging will solidify your skills and help you become a more efficient developer.


Post Comment